
The service-wide USCIS denial rate rose from 8.9% in FY2025 Q1 to 15.9% in FY2026 Q3. USCIS recorded fewer denials in the later quarter, but approvals fell much faster. A rising denial rate can reflect a sharp drop in approvals as much as an increase in denials.
USCIS completed 96.5 cases for every 100 it received in FY2025 Q1. By FY2026 Q3, that figure had fallen to 72.8. Total pending cases rose from 9.68 million to 12.81 million over the same period. The agency's net backlog grew from 4.29 million to 7.74 million.
This analysis uses seven quarterly USCIS reports covering October 2024 through June 2026. We also checked the detailed quarterly reports for N-400, I-130, I-765, and I-485, along with the separate net-backlog reports. The detailed totals matched the service-wide report totals at both ends of the series.
Why quarterly data gives a clearer picture
Monthly reports help reveal sudden changes, but a single month can be distorted by a small number of decisions or a batch of older cases. Quarterly reports cover more cases and make it easier to compare forms over the same periods.
USCIS fiscal quarters do not follow the calendar year:
- FY2025 Q1 covers October through December 2024.
- FY2025 Q2 covers January through March 2025.
- FY2025 Q3 covers April through June 2025.
- FY2025 Q4 covers July through September 2025.
- FY2026 Q1 through Q3 cover October 2025 through June 2026.
This article uses three measures.
Denial rate means denials divided by approvals plus denials in the same quarter. It measures the share of approval-or-denial decisions that ended in denial. Many applications remain pending, so it does not measure the share of everyone who filed.
Completions per 100 receipts compares the cases USCIS completed with the new cases it received during the quarter. A result below 100 means fewer cases were completed than came in. Applications completed in a quarter may have been filed much earlier. This measures workload; it is not an approval rate for a group of applications filed together.
Pending cases include the full inventory waiting for action. Net backlog is narrower: USCIS excludes cases delayed by customer action, such as time spent waiting for a response to a request for evidence. Our guide to the USCIS net backlog explains that distinction.
Denial rates did not move together
The heatmap below separates forms that the earlier monthly analysis combined. I-130 immediate-relative petitions ended FY2026 Q3 with a 16.8% denial rate, while other-relative petitions reached 52.8%. The combined I-765 rate also hides categories moving in opposite directions.
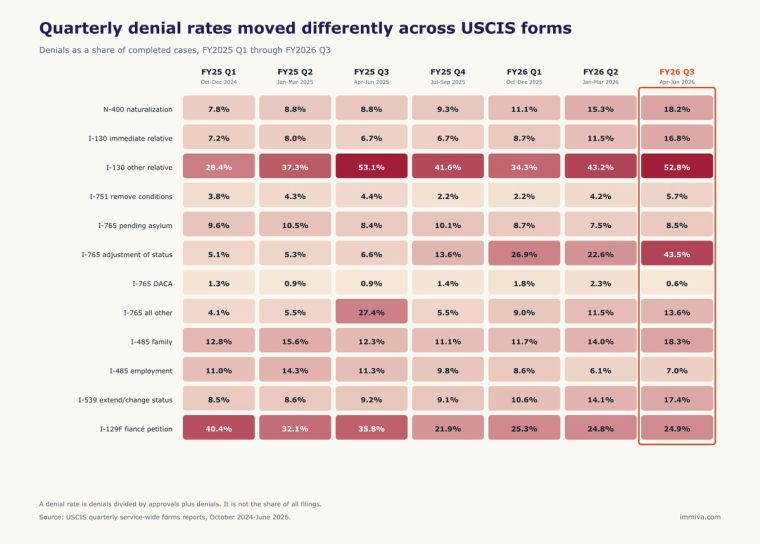
Quarterly denial rates for 12 USCIS form categories from FY2025 Q1 through FY2026 Q3.
The service-wide rate rose from 8.9% to 15.9%. Approvals fell from 2.78 million to 1.30 million, a 53% decrease. Denials fell by about 10%, from 273,599 to 245,471. The rate increased because the approval count dropped far more sharply than the denial count.
A denial rate describes the mix of completed approval-or-denial decisions. It can rise even when USCIS issues fewer denials, so it cannot tell you how many applicants were denied or the risk attached to a new filing.
I-751: more receipts, far fewer completions
I-751 had the lowest denial rate among the main family, citizenship, and work-permit forms in this analysis. It also had the steepest deterioration in workload measures.
USCIS received 29,804 I-751 petitions in FY2025 Q1 and completed 28,912. By FY2026 Q3, receipts had risen to 51,225 while completions had fallen to 10,994. The agency went from completing 97 cases per 100 receipts to 21.5.
Pending I-751 petitions rose from 217,204 to 339,830, an increase of 56%. Net backlog rose from 167,400 to 244,100. The reported processing time was 22.6 months in FY2026 Q3, after reaching 25 months in the preceding quarter.
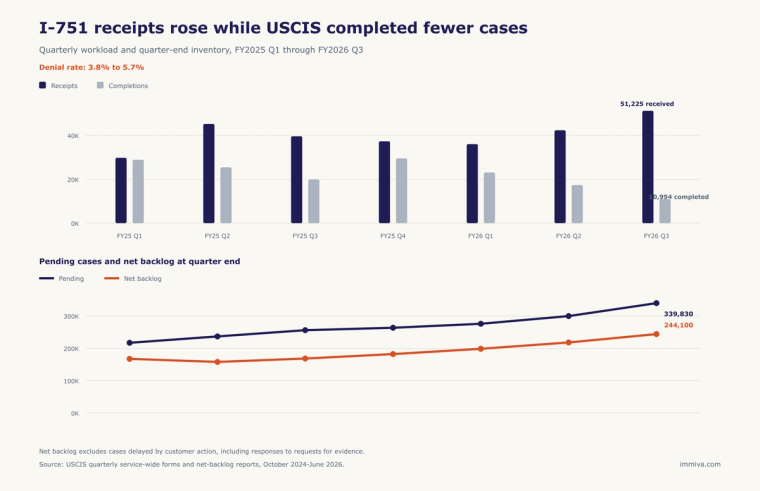
I-751 quarterly receipts and completions, followed by pending cases and net backlog at quarter end.
The I-751 denial rate rose from 3.8% to 5.7%. Denials fell from 1,093 to 626, while approvals fell from 27,819 to 10,368. That larger drop in approvals pushed the rate up. For an I-751 filer, the widening gap between new receipts and completed cases is the clearest sign of how the agency's work changed.
Our I-751 processing-time guide tracks the current wait. The I-751 evidence checklist covers the records used to show a bona fide marriage.
I-765: one form, several different trends
The combined I-765 denial rate rose from 6.6% to 15.5%. The changes varied widely by eligibility category.
The sharpest change was category C09 for people with a pending I-485 adjustment application. Its denial rate rose from 6.2% to 52.6%. Approvals fell from 130,069 to 32,249, while denials rose from 8,526 to 35,720. Pending C09 applications grew from 153,874 to 671,263.
The service-wide report groups C09 with the related advance-parole category. Under that broader definition, the adjustment-of-status EAD denial rate rose from 5.1% to 43.5%. Both sources show an increase; the rates differ because they cover different categories.
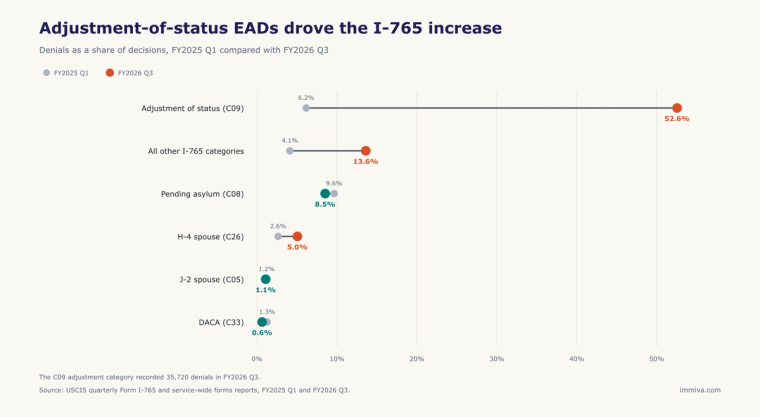
I-765 denial rates by eligibility category in FY2025 Q1 and FY2026 Q3.
Other categories changed less. The denial rate for H-4 spouse EADs rose from 2.6% to 5.0%. For J-2 EADs, it was nearly unchanged at 1.2% and 1.1%. Pending-asylum EAD denial rates fell from 9.6% to 8.5%, and DACA EAD denial rates fell from 1.3% to 0.6%.
Across all I-765 categories, pending applications rose from 1.17 million to 2.11 million. The separate I-765 aging report counted about 1.07 million initial and renewal applications pending for at least 180 days at the end of FY2026 Q3. That report uses a slightly different inventory definition, so its total does not exactly equal the service-wide pending count.
Applicants facing an expiration date can use our guide on why filing an EAD renewal early matters.
N-400 naturalization
The combined military and nonmilitary N-400 denial rate rose from 7.8% to 18.2%. Approvals fell from 205,488 to 57,697, while denials fell from 17,302 to 12,842. Pending applications rose from 531,872 to 742,138.
USCIS completed 92 N-400 cases for every 100 receipts in FY2025 Q1 and 48 in FY2026 Q3. For the main nonmilitary N-400 category, the reported processing time rose from 5.5 months to 9.5 months.
National totals cannot explain why a particular field office or applicant has a different outcome. Our separate analysis covers N-400 denial rates by field office. The N-400 processing-time guide tracks the latest quarterly volumes.
I-130 family petitions
The largest difference within I-130 was between immediate relatives and all other relatives. Combining the petitions would hide it.
For immediate relatives, the denial rate rose from 7.2% to 16.8%. Pending petitions fell by 7.7%, and completions per 100 receipts improved from 70.7 to 78.5. The reported processing time declined from 14.3 months to 13 months.
For all other relatives, the denial rate rose from 28.4% to 52.8%. Pending petitions increased to 1.62 million, and the reported processing time rose from 33.6 months to 43.3 months. This category includes preference relatives who often wait for visa availability after petition approval, so the pending number reflects more than USCIS adjudication speed alone.
See the I-130 processing-time guide and I-130 document checklist for the filing stages and evidence requirements.
I-485 adjustment of status
Family-based and employment-based I-485 applications moved in different directions.
The family-based denial rate rose from 12.8% to 18.3%. Pending applications increased from 548,621 to 611,067, while completions per 100 receipts slipped from 74.5 to 70.3.
The employment-based denial rate fell from 11.0% to 7.0%, even as its pending inventory grew by 48%. Completions per 100 receipts fell from 83.3 to 46.4.
The refugee, Cuban, and asylum adjustment categories need careful interpretation. In some quarters, approvals fell close to zero. Even a modest number of denials then produces a very high rate. We left those categories out of the heatmap because the percentage can suggest a broad change in applicant eligibility when the underlying issue is extremely low adjudication volume.
Our I-485 processing-time guide and family green-card backlog analysis cover those stages separately.
Throughput changed as much as denial rates
I-751 had the largest workload reversal, followed by N-400 and adjustment-based I-765 applications. Some categories improved: I-129F fiancé petitions rose from 68 to 95 completions per 100 receipts, and immediate-relative I-130 petitions rose from 71 to 79.
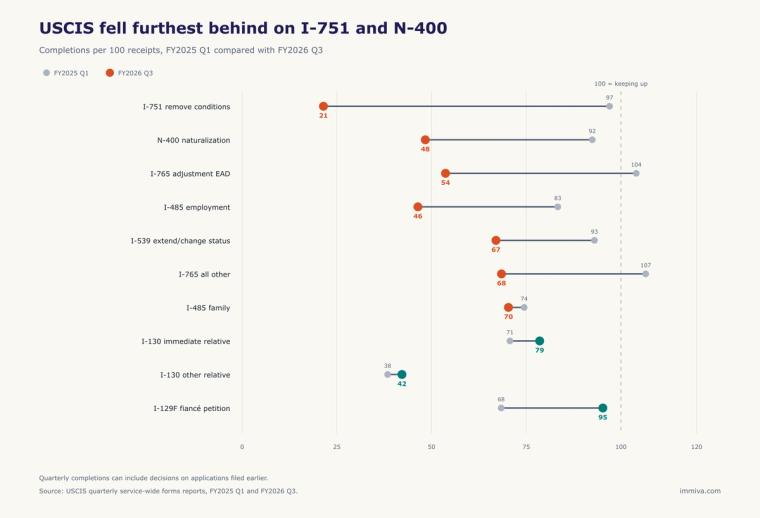
Completions per 100 receipts for major USCIS forms in FY2025 Q1 and FY2026 Q3.
I-539 applications to extend or change nonimmigrant status also had fewer completions relative to receipts. Their denial rate rose from 8.5% to 17.4%. Pending cases nearly doubled to 133,056, and completions per 100 receipts fell from 93 to 67.
These ratios show whether quarterly output kept pace with quarterly intake. They do not follow the same applications into and out of the system. A sustained result below 100 adds pressure to the pending inventory unless another part of the caseload is removed or reclassified.
What the quarterly data means for a pending case
A form with a 20% denial rate does not give every new applicant a one-in-five chance of denial. The data describes USCIS operations and cannot predict the outcome of an individual case. Completed cases may have been filed in different periods, under different rules, and with a different mix of eligibility issues.
Many categories ended FY2026 Q3 with fewer completions relative to receipts and a larger pending inventory. A rejection, request for evidence, or avoidable filing error can therefore cost more time because the case returns to a slower system.
USCIS quarterly output is outside your control. Before filing, you can check the form edition and fee, answer the eligibility questions accurately, and include the required evidence. You can also file once you are eligible. Our explanation of USCIS average processing time shows why one national number cannot predict the wait for a particular case.
What you can control before filing
Use the current form edition and correct fee. A lockbox rejection means USCIS never accepted the filing, so you lose time before joining the queue.
Answer sensitive questions carefully. Questions about travel, address history, arrests, prior filings, and good moral character often require more context than the short form wording provides. An incomplete or inconsistent answer can lead to a request for evidence or a denial months later.
Tie each piece of evidence to the requirement it proves. For I-751, that means evidence covering the marriage over time. For I-130 and I-485, it means civil documents, relationship evidence, and financial records that match the category. For N-400, it includes residence, physical presence, and tax history where applicable.
Immiva prepares and checks N-400, I-751, I-130, and I-485 filings, plus H-4 and J-2 work permits. The software validates answers and flags issues for review. It also checks the packet before download. Immiva does not provide legal advice or representation. Applicants who need advice about strategy, waivers, removal proceedings, or a disputed immigration history should speak with an immigration attorney.
The short version
Quarterly USCIS data shows a service-wide denial rate increase from 8.9% to 15.9% between FY2025 Q1 and FY2026 Q3. Approvals fell much faster than denials. Total completions dropped from 3.09 million to 1.58 million, and pending cases rose to 12.81 million.
The results varied by form. I-751 had a severe throughput decline. Adjustment-based I-765 applications drove much of the work-permit increase. N-400 and both I-130 categories had higher denial rates, while employment-based I-485 and several I-765 categories moved the other way.